Cartophilia: Rivers of Time
Nothing melds art and science like a map. This regular column by Pioneer Works alum and advisor Joshua Jelly-Schapiro, illuminating some of Jelly-Schapiro’s favorite maps from history, explores cartography’s power to mold our minds and move our feet.
“The Mississippi River created most of Louisiana, and it could not have done so if it remained in one channel.” So wrote John McPhee in a classic 1987 piece for The New Yorker, about how the U.S. Army Corps of Engineers endeavors to maintain the current route of North America’s greatest river across the broad alluvial plain over which its waters have continually changed course, often to significant effect, for millennia. In that article which became the basis for McPhee’s book The Control of Nature, the writer focused on the Corps’ herculean efforts, a couple hundred miles above New Orleans. This is where its spillways and dikes prevent the river’s main channel from pouring into Louisiana’s Atchafayala Basin, as has been its desire for decades now, rather than continuing toward the storied port that French settlers established near its mouth in 1718, and the critical nodes of American industry (petrochemical firms, mostly) that have clustered nearby since. “For the Mississippi to make such a change was completely natural,” McPhee wrote, “but in the interval since the first Europeans had settled beside the river, a nation had developed, and the nation could not afford nature.” Across 28,000 vivid words on that nation’s efforts to control nature here, McPhee described his adventures with Cajun crawfishermen on a skiff called Mon Ark, and many arcane yet fascinating facts about hydrology and silt. But none of those 28,000 words paint a more vivid picture of his subject than an astonishing series of hand-drawn maps, from a few decades before.
Harold Fisk produced his “Meander Belt Maps” in 1944 for—who else—the Army Corps of Engineers. Fisk designed his moist masterworks to accompany an otherwise bone-dry report on the Corps’ Geological Investigation of the Alluvial Valley of the Lower Mississippi River. Divided into fifteen detailed plates, they span some 900 miles of the river’s length (500 as the crow flies), from Cape Girardeau, Missouri, to Donaldsonville, Louisiana. To create them, Fisk began by overlaying a contemporary map of the river’s course with reliable charts of its route from 1880, 1820, and 1765—a first step that offered a striking vision of how Big Muddy’s bends had shifted even in the brief century between Huck Finn’s day and Fisk’s own. But then Fisk reached back further. He used fresh data whose gathering the Corps had commissioned in the wake of some catastrophic floods in the early twentieth century, to better understand the river’s whims and character over the longue durée. The Corps’ engineers bored 16,000 holes deep into the sediment of the river’s ”meander belt.” Then they pulled up data that allowed Fisk to chart where it flowed back when the great Algonquian city of Cahokia, overlooking its waters in current-day Illison, boasted a populace equal to London’s in the 14th century—and also from much further back than that, when mastodons nosed its banks.
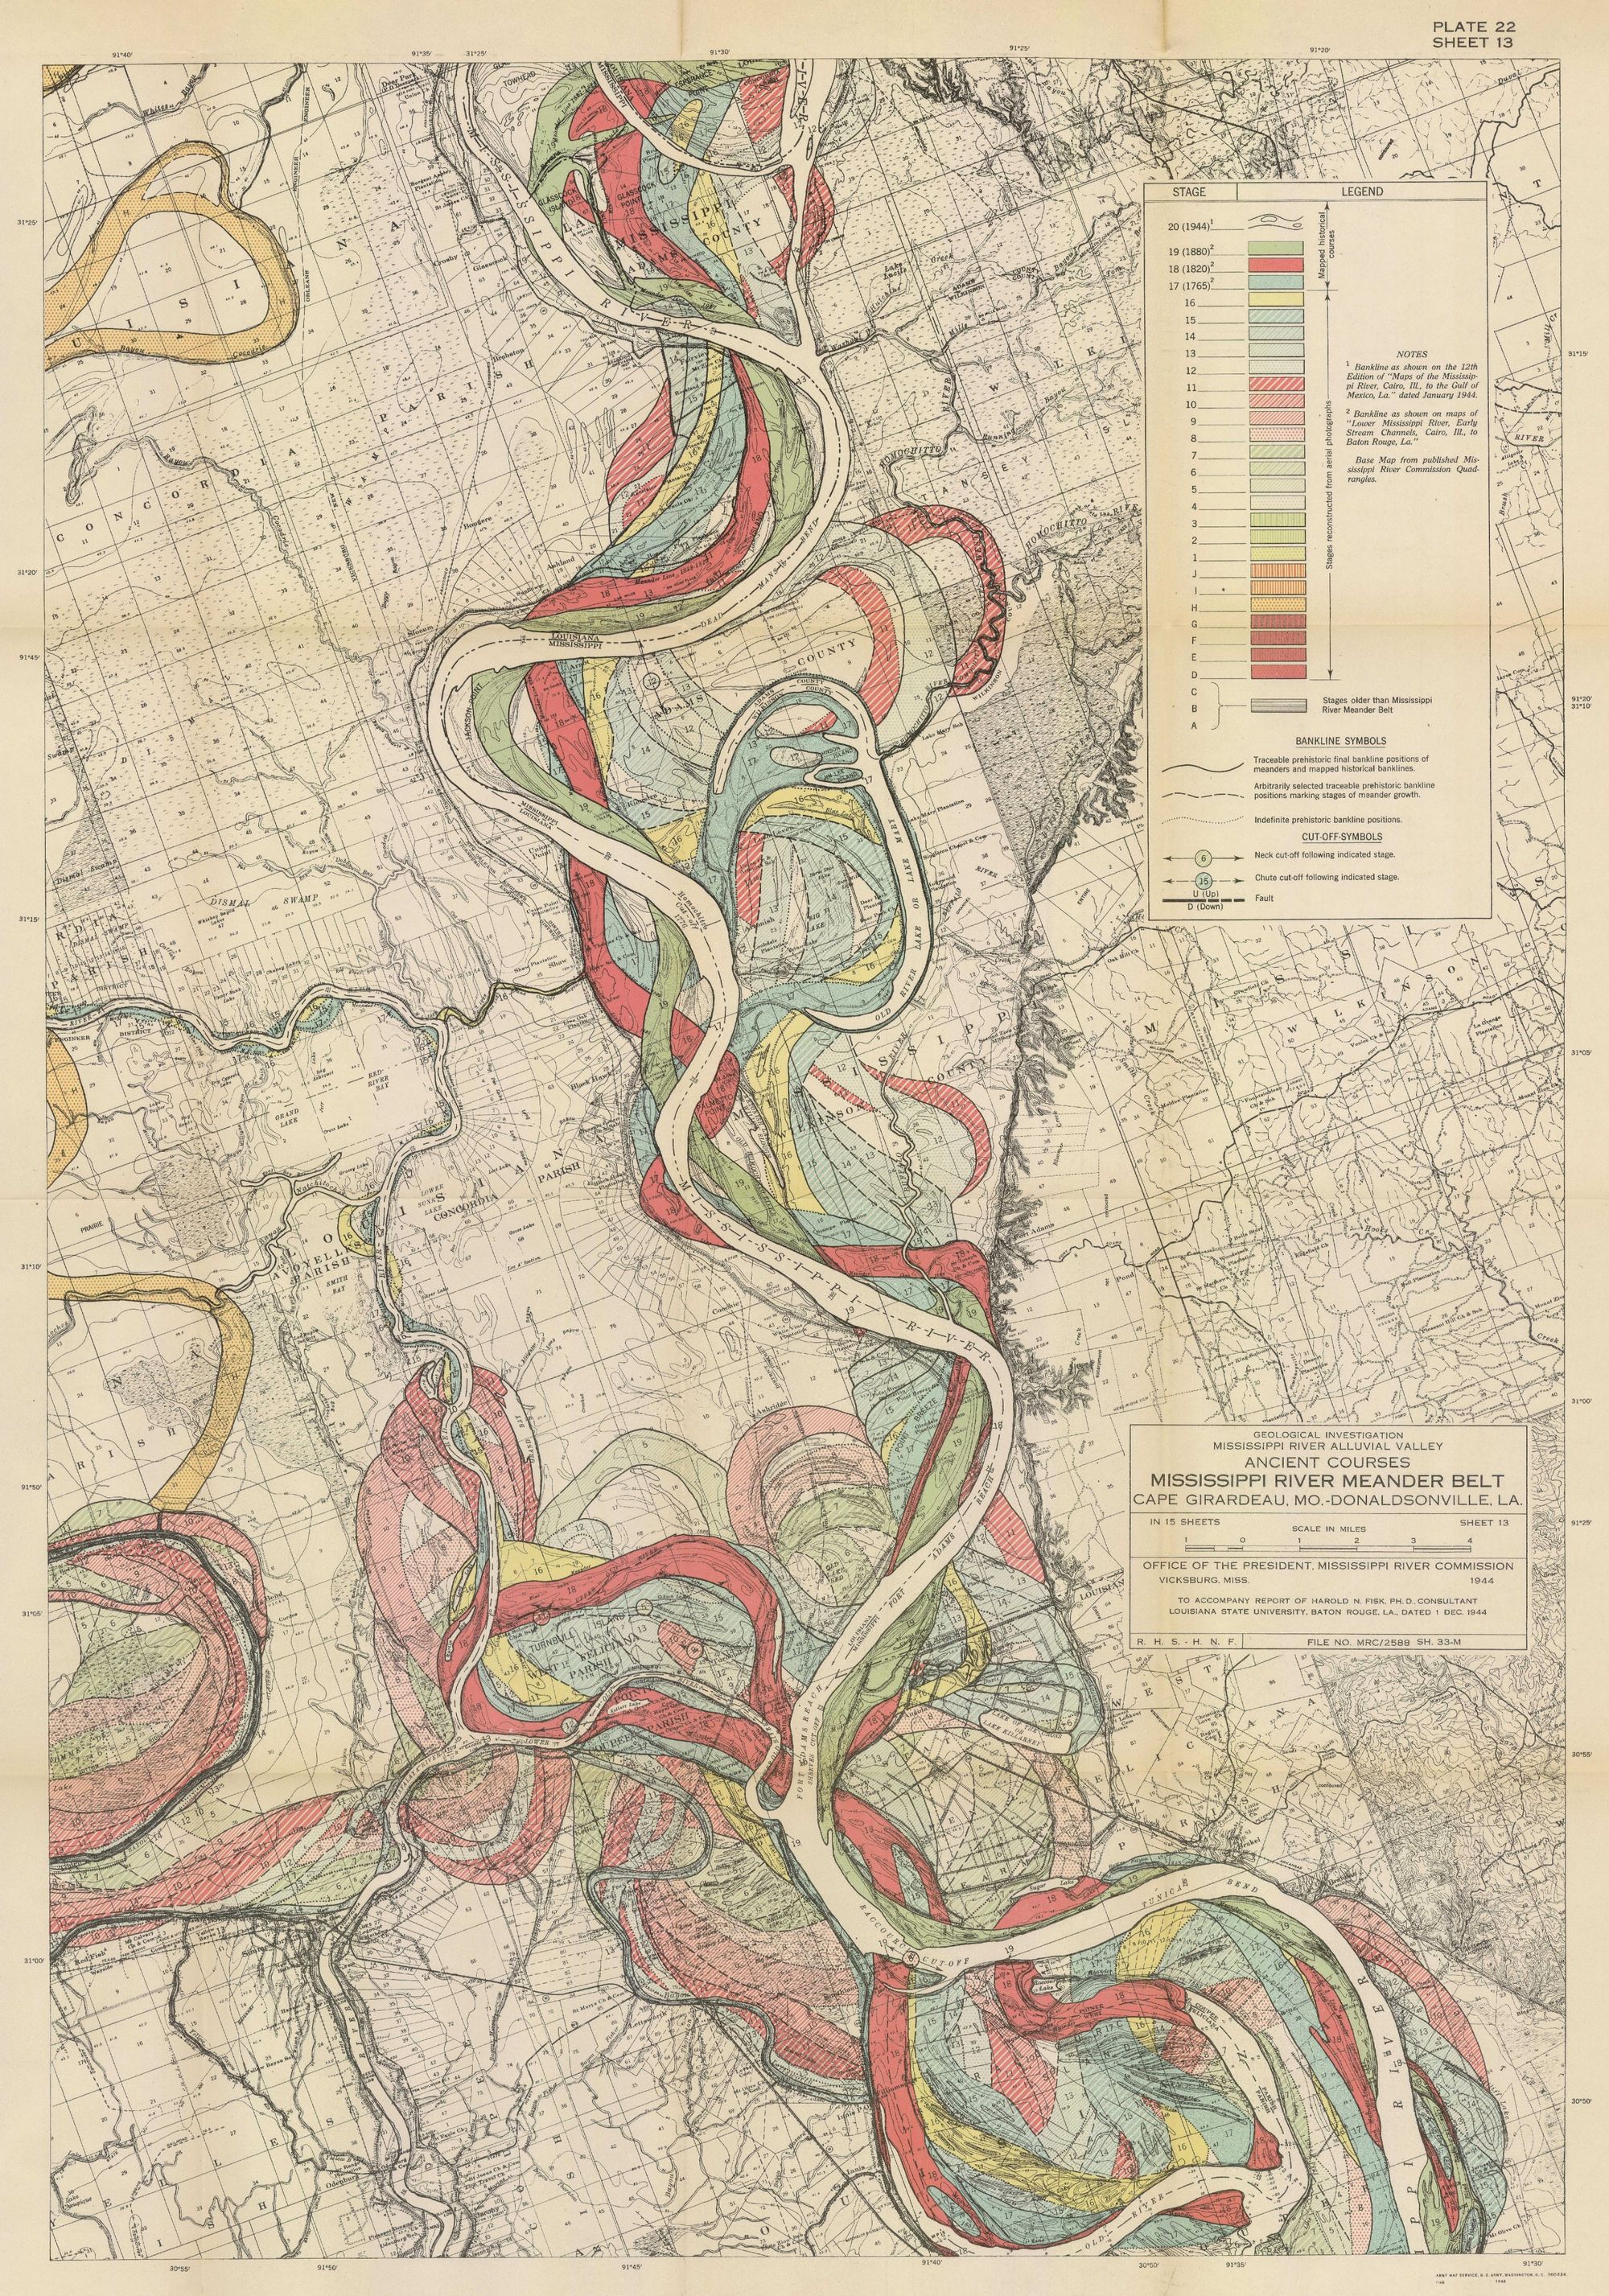
The result, on each of Fisk’s fifteen detailed plates, wasn’t merely a cartographic document of remarkable perspicacity and worth. His maps are astonishing visual objects: His Medusa’s heads of riverine strands, with their entwined bands of pale ochre and cobalt and lime, can’t but put one in mind, as only great paintings can, of both mathematics and myth.
Fisk’s maps, born of science, are no doubt art. But they also remind us that most maps are more akin to snapshots than to films. We look to modern maps to teach us how a city or country is. We look at historical maps to learn how such places were (or how their past inhabitants, in any case, saw them). In recent years, ever-more-powerful microchips have enabled us to turn gigabytes of geographic data into digital maps of astonishing complexity that often feature glowing animations, too: On our screens, the spatial charting of change across time has grown common (at least for the map geeks and programmers for whom LIDAR and GIS are holy initials). But part of what’s distinctive about Fisk’s charts is the inspired way he found to at once represent and evoke time’s passing on paper. No feature of North America’s landscape has been so freighted with meaning and metaphor as the watercourse that drains 42% of its H2O. But I know no depiction of its nature that makes those metaphors feel more real than Fisk’s stunning charts of how the great river’s waters—and its soul, if you like—wander space and time. ♦
Subscribe to Broadcast